Please upgrade your Keptn to a newer release.
Home / Docs / Release 0.5.2 / Tutorials / Self-healing with Keptn
Self-healing with Keptn
Demonstrates how to use the self-healing mechanisms of Keptn to self-heal a demo service, which runs into issues, by providing automated upscaling.
About this tutorial
In this tutorial you will learn how to use the capabilities of Keptn to provide self-healing for an application without modifying any of the applications code. The tutorial presented in the following will scale up the pods of an application if the application undergoes heavy CPU saturation.
Prerequisites
Finish the Onboarding a Service tutorial.
Clone the example repository, which contains specification files:
git clone --branch 0.5.0 https://github.com/keptn/examples.git --single-branch
Configure monitoring
To inform Keptn about any issues in a production environment, monitoring has to be set up. The Keptn CLI helps with automated setup and configuration of Prometheus as the monitoring solution running in the Kubernetes cluster.
For the configuration, Keptn relies on different specification files that define service level indicators (SLI), service level objectives (SLO), and remediation actions for self-healing if service level objectives are not achieved. To learn more about the service-indicator, service-objective, and remediation file, click here Specifications for Site Reliability Engineering with Keptn.
In order to add these files to Keptn and to automatically configure Prometheus, execute the following commands:
Make sure you are in the correct folder of your examples directory:
cd examples/onboarding-cartsConfigure Prometheus with the Keptn CLI:
keptn add-resource --project=sockshop --service=carts --stage=production --resource=service-indicators.yaml --resourceUri=service-indicators.yaml
keptn add-resource --project=sockshop --service=carts --stage=production --resource=service-objectives-prometheus-only.yaml --resourceUri=service-objectives.yaml
keptn add-resource --project=sockshop --service=carts --stage=production --resource=remediation.yaml --resourceUri=remediation.yaml
keptn configure monitoring prometheus --project=sockshop --service=carts
Executing this command will perform the following tasks:
- Set up Prometheus
- Configure Prometheus with scrape jobs and alerting rules for the service
- Set up the Alert Manager to manage alerts
- Add the
service-indicators.yaml,service-objectives.yamlandremediation.yamlto your Keptn configuration repository
Inspect the files that have been added here
service-indicators.yaml
  indicators:
  - metric: cpu_usage_sockshop_carts
  source: Prometheus
  query: avg(rate(container_cpu_usage_seconds_total{namespace="sockshop-$ENVIRONMENT",pod_name=~"carts-primary-.*"}[5m]))
  - metric: request_latency_seconds
  source: Prometheus
  query: rate(requests_latency_seconds_sum{job='carts-sockshop-$ENVIRONMENT'}[$DURATION])/rate(requests_latency_seconds_count{job='carts-sockshop-$ENVIRONMENT'}[$DURATION])
  - metric: request_latency_dt
  source: Dynatrace
  queryObject:
    - key: timeseriesId
    value: com.dynatrace.builtin:service.responsetime
    - key: aggregation
    value: AVG
service-objectives.yaml
  pass: 90
  warning: 75
  objectives:
  - metric: request_latency_seconds
  threshold: 0.8
  timeframe: 5m
  score: 50
  - metric: cpu_usage_sockshop_carts
  threshold: 0.2
  timeframe: 5m
  score: 50
remediation.yaml
  remediations:
  - name: cpu_usage_sockshop_carts
  actions:
  - action: scaling
      value: +1
Run the tutorial
Deploy an unhealthy service version
In order to test the self-healing capabilities, deploy an unhealthy version of the carts microservice. This version has some issues that are not detected by the automated quality gates since the tests generate artificial traffic while in production real user traffic might reveal untested parts of the microservice that have issues.
Therefore, please make sure that you have completed the Onboarding a Service or the Deployment with Quality Gates tutorial (i.e., all shown versions contain issues that are not detected by the quality gates).
You can check if the service is already running in your production stage by executing the following command and reviewing the output. It should show two pods in total.
kubectl get pods -n sockshop-production
NAME                              READY   STATUS    RESTARTS   AGE
carts-db-57cd95557b-r6cg8         1/1     Running   0          18m
carts-primary-7c96d87df9-75pg7    1/1     Running   0          13m
Generate load for the service
In order to simulate user traffic that is causing an unhealthy behavior in the carts service, please execute the following script. This will add special items into the shopping cart that cause some extensive calculation.
Change into the folder with the load generation program within the examples repo:
cd ../load-generation/binStart the load generation script depending on your OS (replace _OS_ with linux, mac, or win):
./loadgenerator-_OS_ "http://carts.sockshop-production.$(kubectl get cm keptn-domain -n keptn -o=jsonpath='{.data.app_domain}')" cpu(optional:) Verify the load in Prometheus.
- Make a port forward to access Prometheus:
kubectl port-forward svc/prometheus-service -n monitoring 8080:8080Access Prometheus from your browser on http://localhost:8080.
In the graph tab, add the expression
avg(rate(container_cpu_usage_seconds_total{namespace="sockshop-production",pod_name=~"carts-primary-.*"}[5m]))Select the graph tab to see your CPU metrics of the
carts-primarypods in thesockshop-productionenvironment.You should see a graph which locks similar to this:
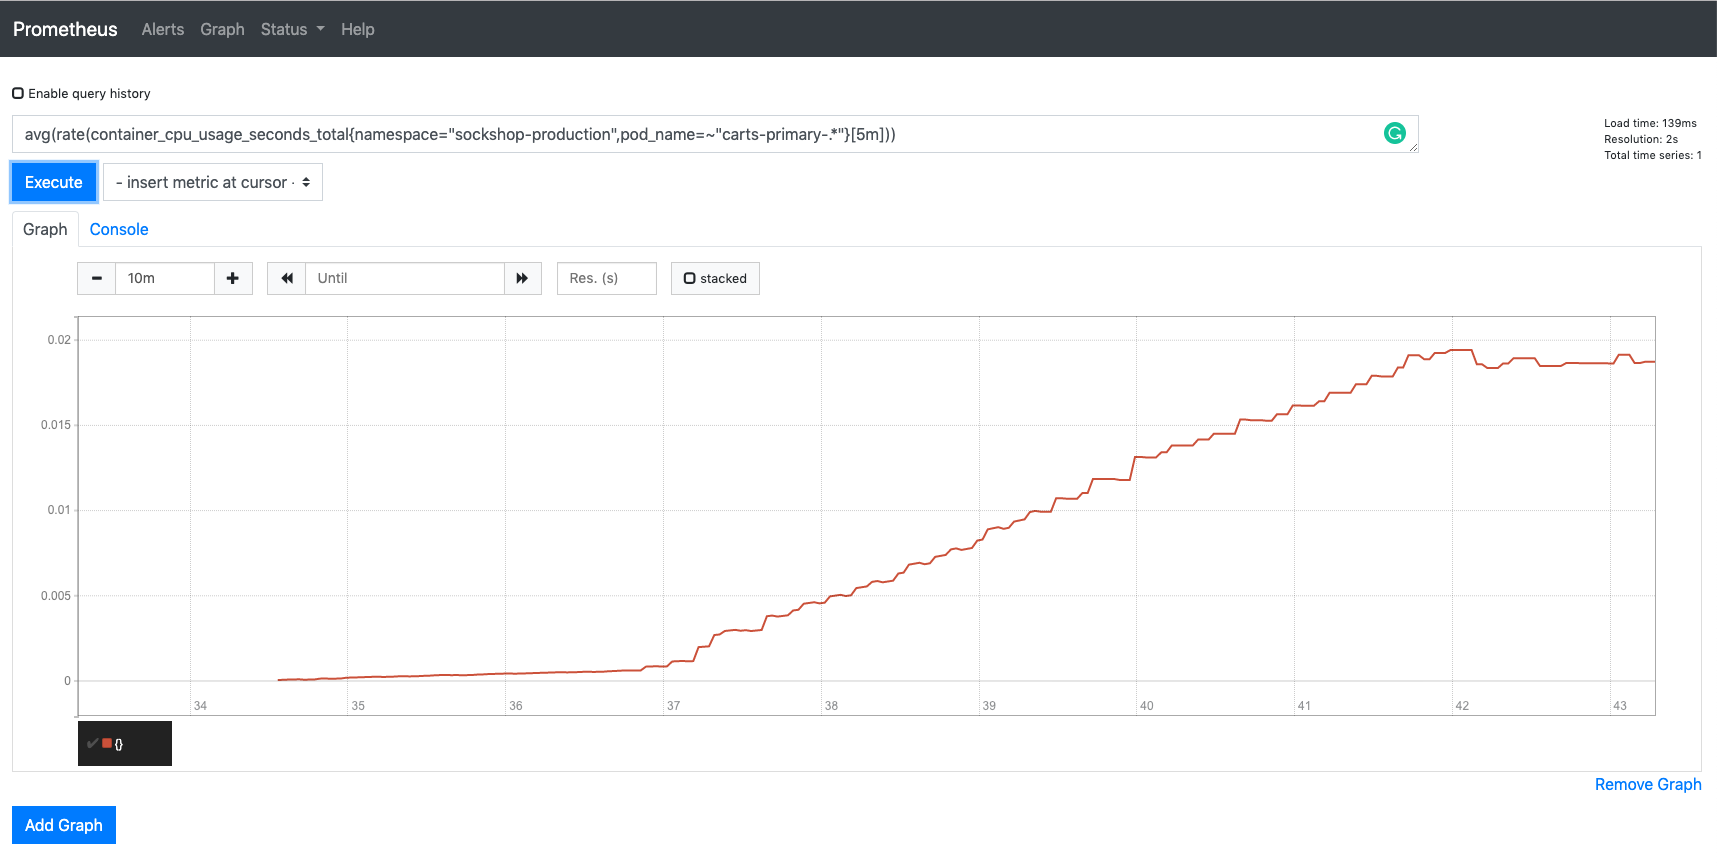
Prometheus load
Watch self-healing in action
After approximately 15 minutes, the Prometheus Alert Manager will send out an alert since the service level objective is not met anymore.
To verify that an alert was fired, select the Alerts view where you should see that the alert
cpu_usage_sockshop_cartsis in thefiringstate: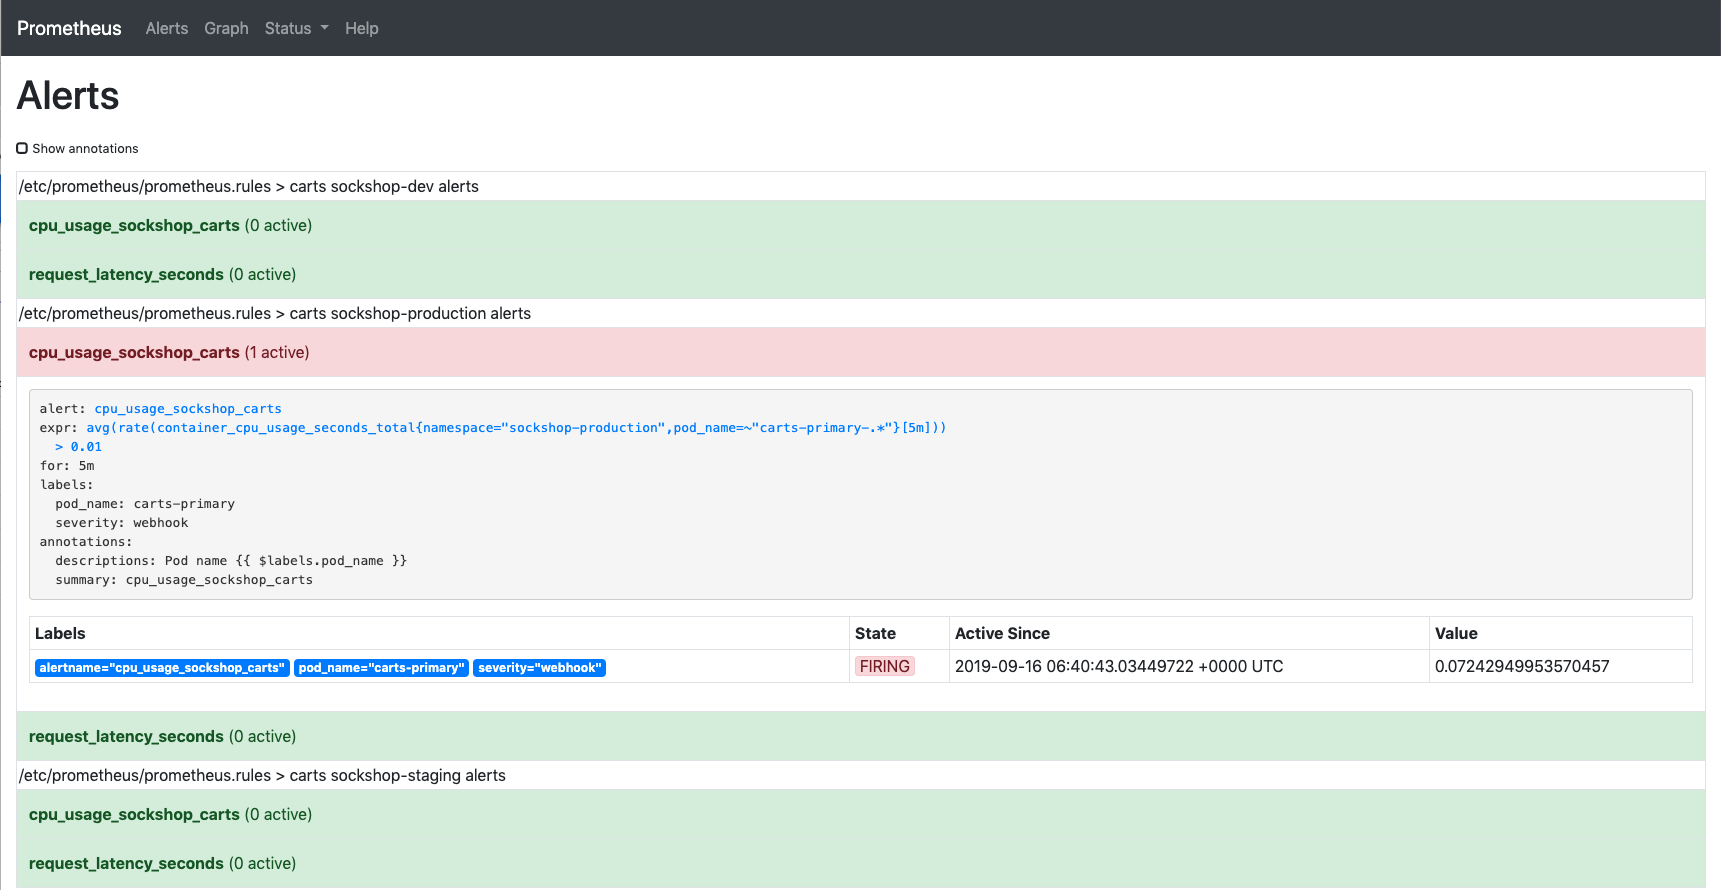
Alert manager
The alert will be received by the Prometheus service that will translate it into a Keptn CloudEvent. This event will eventually be received by the remediation service that will look for a remediation action specified for this type of problem and, if found, executes it.
In this tutorial, the number of pods will be increased to remediate the issue of the CPU saturation.
Check the executed remediation actions by executing:
kubectl get deployments -n sockshop-productionYou can see that the
carts-primarydeployment is now served by two pods:NAME DESIRED CURRENT UP-TO-DATE AVAILABLE AGE carts-db 1 1 1 1 37m carts-primary 2 2 2 2 32mAlso you should see an additional pod running when you execute:
kubectl get pods -n sockshop-productionNAME READY STATUS RESTARTS AGE carts-db-57cd95557b-r6cg8 1/1 Running 0 38m carts-primary-7c96d87df9-75pg7 2/2 Running 0 33mFurthermore, you can use Prometheus to double-check the CPU usage:
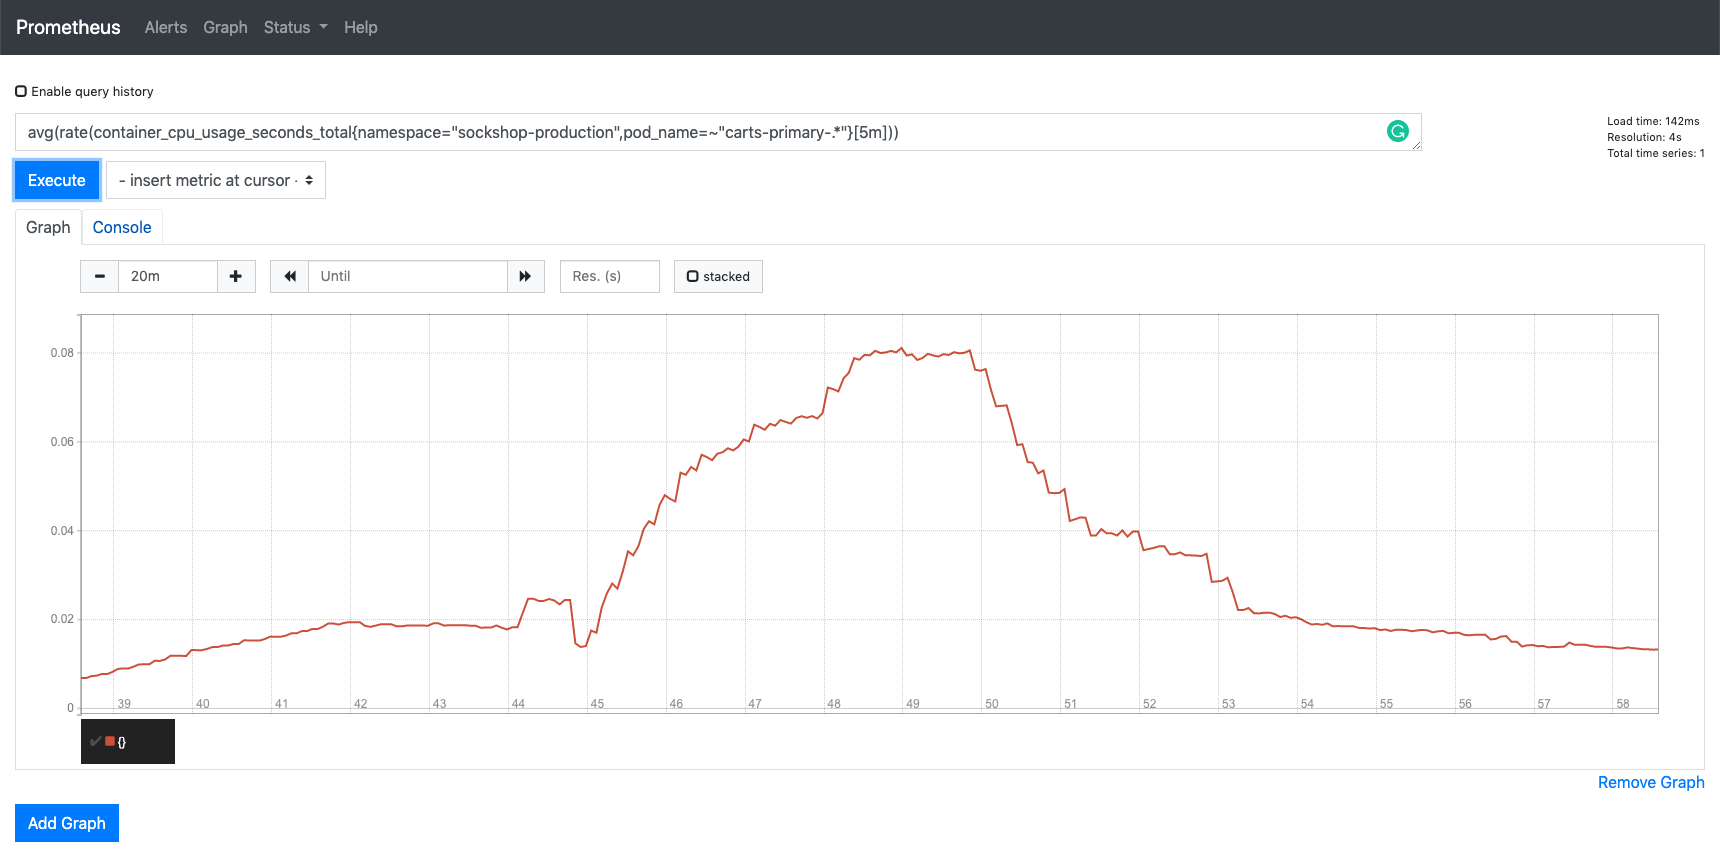
Prometheus load Finally, to get an overview of the actions that got triggered by the Prometheus alert, you can use the bridge. You can access it by a port-forward from your local machine to the Kubernetes cluster:
kubectl port-forward svc/bridge -n keptn 9000:8080Now access the bridge from your browser on http://localhost:9000.
In this example, the bridge shows that the remediation service triggered an update of the configuration of the carts service by increasing the number of replicas to 2. When the additional replica was available, the wait-service waited for three minutes for the remediation action to take effect. Afterwards, an evaluation by the pitometer-service was triggered to check if the remediation action resolved the problem. In this case, increasing the number of replicas achieved the desired effect, since the evaluation of the service level objectives has been successful.
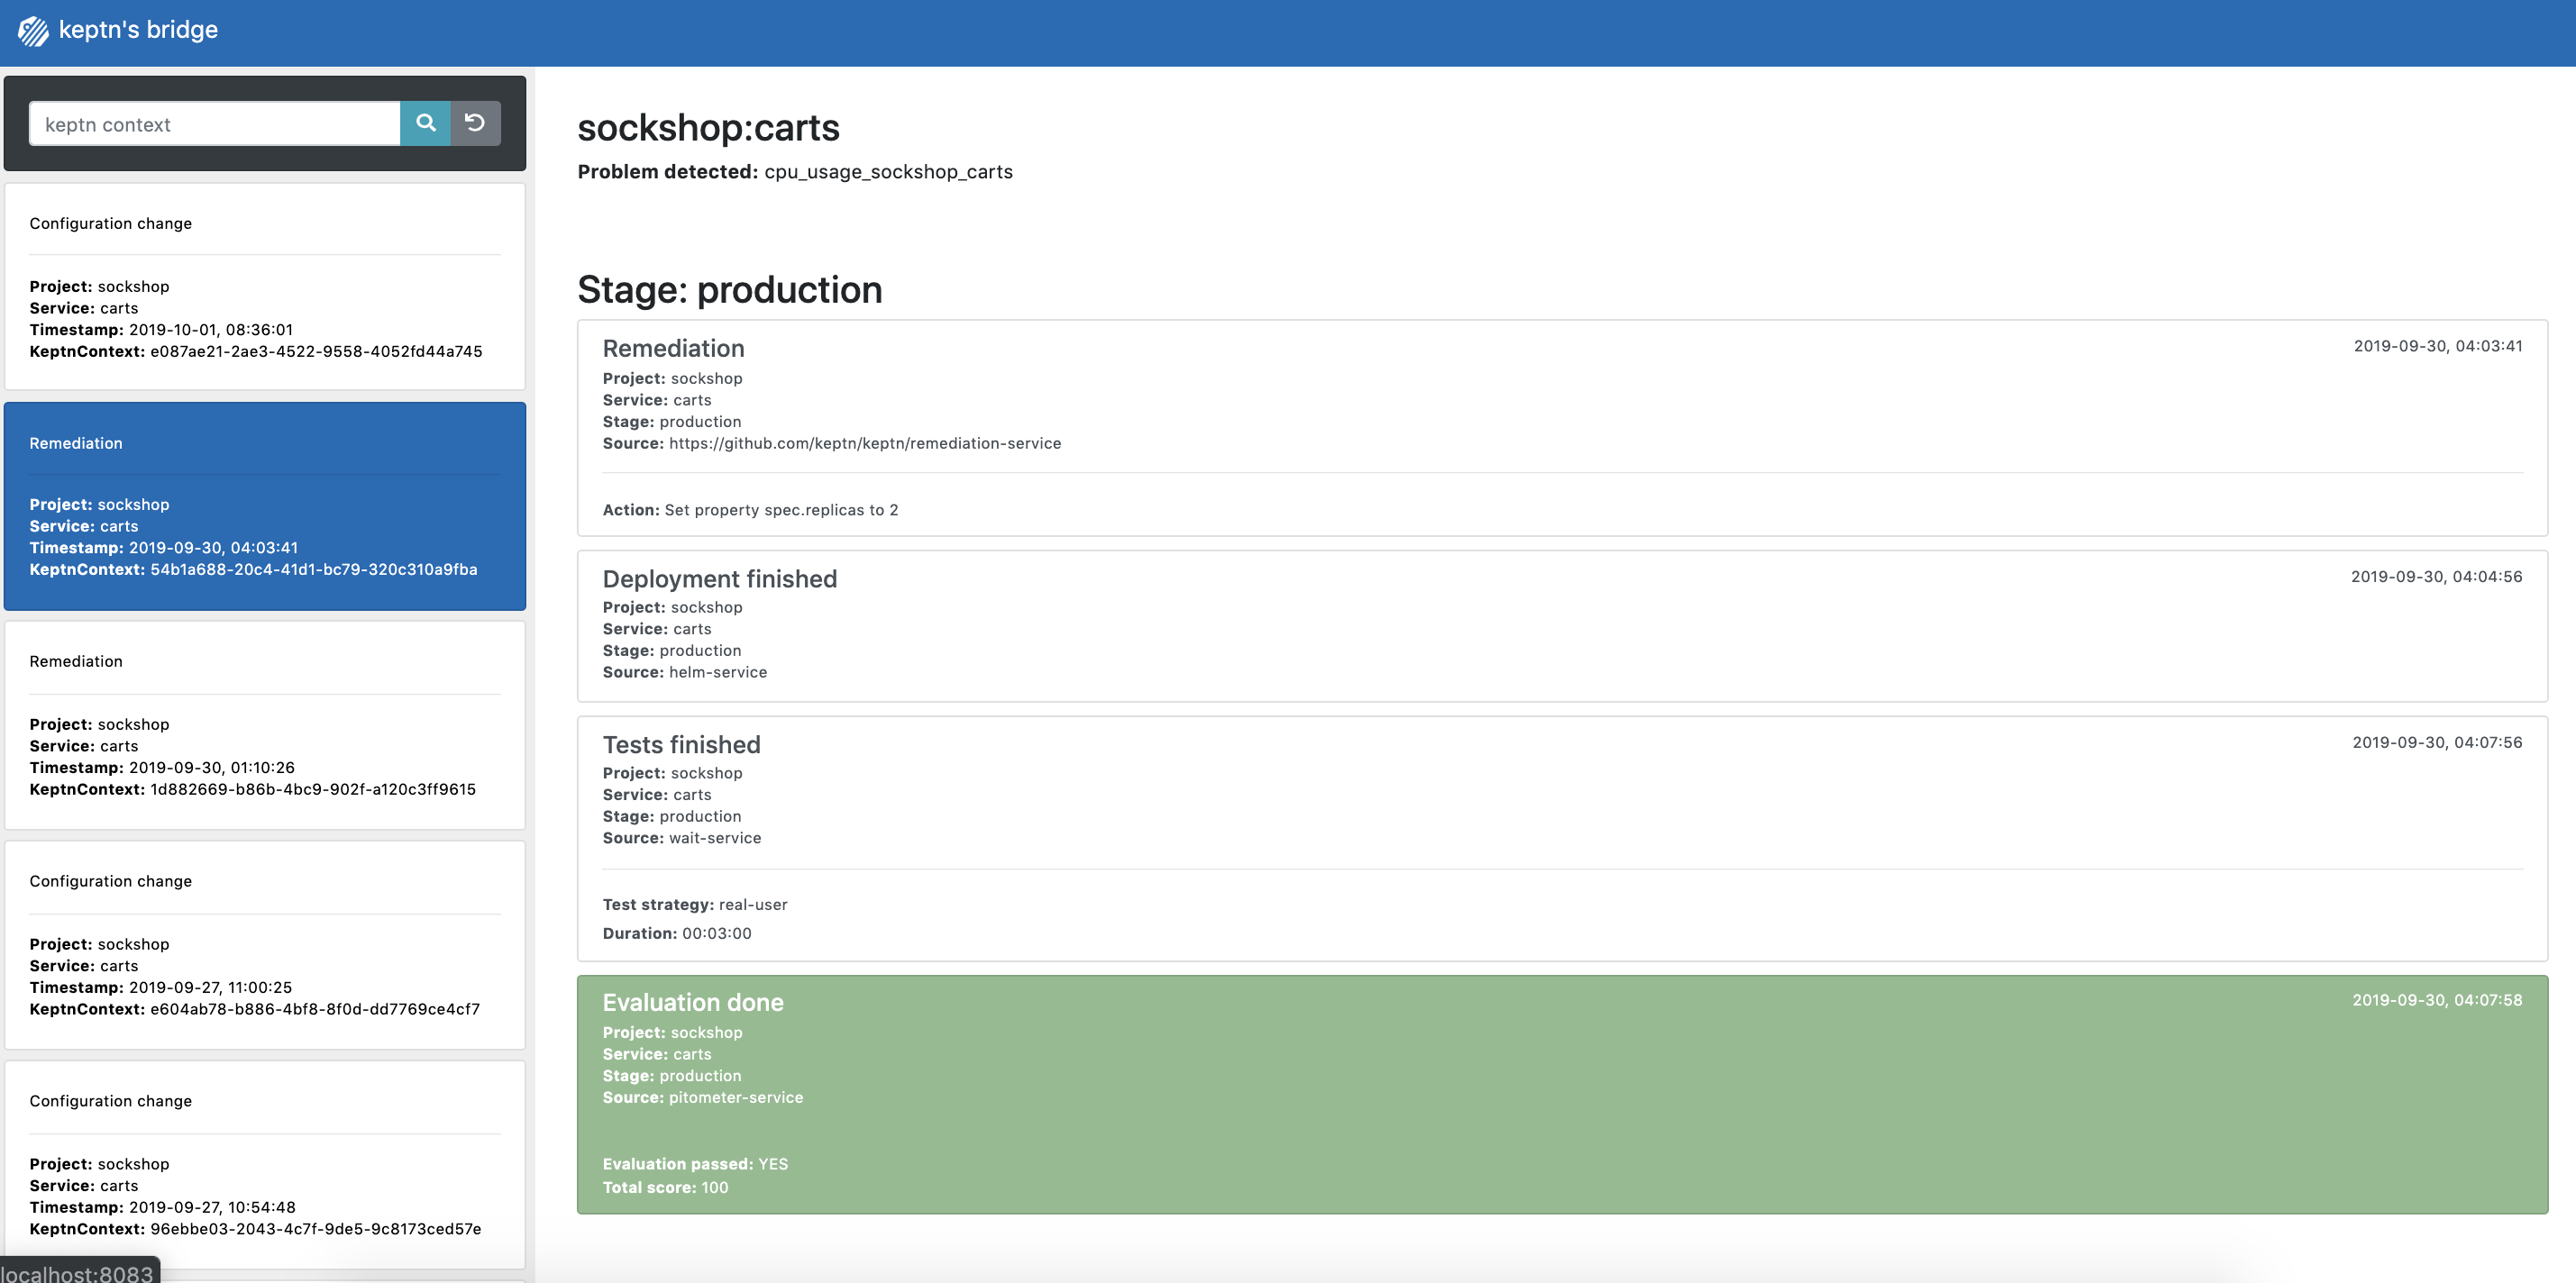
Keptn's Bridge
Built with  by Dynatrace