Home / Docs / Release 0.6.2 / Tutorials / Quality Gates for external Deployments
Quality Gates for external Deployments
Describes how Keptn allows using quality gates without delivery and testing capabilities of Keptn.
About this tutorial
Let’s say you want to use your existing tools to deploy and test your applications - you can still use Keptn`s Quality Gates for the evaluation of Service Level Objectives (SLOs).
A brief recap of SLO and SLI: A Service Level Objective (SLO) is a target value or range of values for a service level that is measured by a Service Level Indicator (SLI). An SLI is a carefully defined quantitative measure of some aspect of the level of service that is provided. By default, the following SLIs can be used for evaluation, inspired by the Site Reliability Engineering book from Google:
- Response time: The time it takes for a service to execute and complete a task or how long it takes to return a response to a request.
- System throughput: The number of requests per second that have been processed.
- Error rate: The fraction of all received requests that produced an error.
For more information about SLO and SLI, please take a look at Specifications for Site Reliability Engineering with Keptn.
Prerequisites
Running Keptn installation or a quality gates only installation as explained below.
Clone example files used for this tutorial:
git clone --branch 0.6.2 https://github.com/keptn/examples.git --single-branchcd examples/onboarding-cartsThe files you need are:
shipyard-quality-gates.yamlslo-quality-gates.yamllighthouse-source-prometheus.yaml|lighthouse-source-dynatrace.yaml
Bring your own monitored service
This tutorial is slightly different compared to the others because you need to bring your own monitored service depending on the monitoring solution you want to use. For the sake of clarification, this tutorial uses a service called catalogue from the project musicshop meaning that you must adapt the commands to match your service and project name.
Once you have deployed your service in your cluster, make sure to configure the monitoring solution so Keptn can gather the right data.
This tutorial assumes that you have Prometheus that is either managed by Keptn or not.
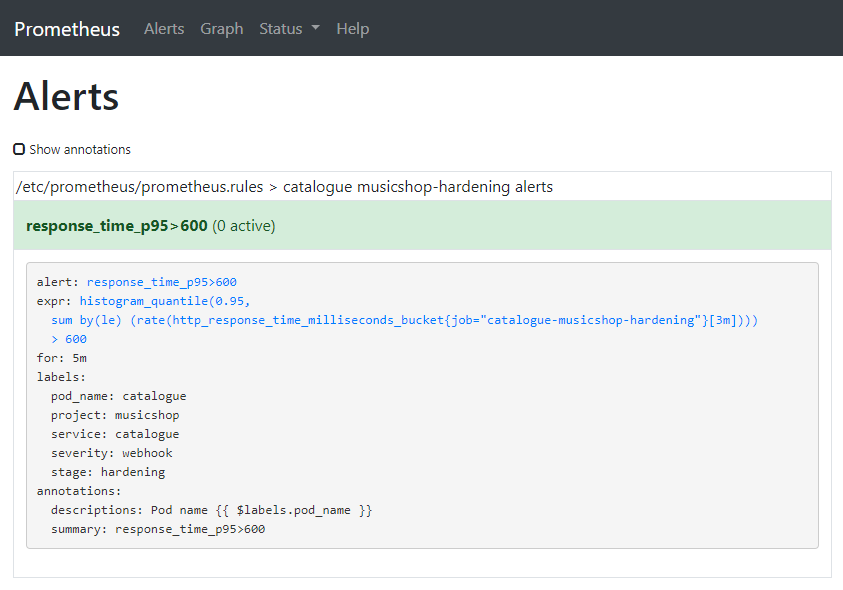
Furthermore, the service has to be monitored by Prometheus. Therefore, a scrape job and an alert rule are required: A scrape job for your service. For more information about configuring a scrape job, see the official Prometheus documentation at section scrape_config. To configure a scrape job for a Prometheus deployed on Kubernetes, you need to update the An alert rule for the SLI and the scrape job. For more information about configuring alert rules, see the official Prometheus documentation at section alerting_rules. To add an alert rule to a Prometheus deployed on Kubernetes, you need to update the Before continue, please verify that you have an alert rule as shown below:Option 1: Instructions for Prometheus
prometheus-server-conf ConfigMap at the prometheus.yml section with an additional scrape job:prometheus.yaml:
----
scrape_configs:
- job_name: catalogue-musicshop-hardening
honor_timestamps: false
metrics_path: /prometheus
static_configs:
- targets:
- catalogue.musicshop-hardening:80
prometheus-server-conf ConfigMap at the prometheus.rules section with an additional group. Please be aware that the values of the label service, stage, and project must match your service, stage, and project as created in the below step.prometheus.rules:
----
groups:
- name: catalogue musicshop-hardening alerts
rules:
- alert: response_time_p95>600
expr: histogram_quantile(0.95,sum(rate(http_response_time_milliseconds_bucket{job='catalogue-musicshop-hardening'}[180s]))by(le))>600
for: 5m
labels:
severity: webhook
pod_name: catalogue
service: catalogue
stage: hardening
project: musicshop
annotations:
summary: response_time_p95>600
descriptions: Pod name {{ $labels.pod_name }}
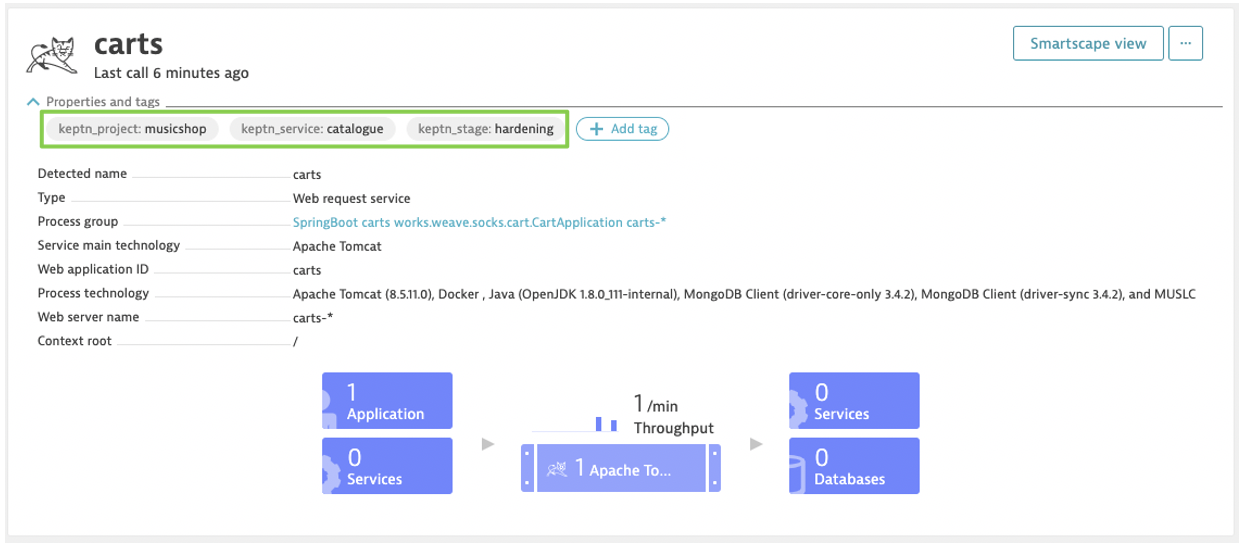
In order for Keptn to extract monitoring data of your specific service it is recommended that you tag your services in Dynatrace in a way that the tags uniquely identify your services. The Keptn best practice is to put a tag for project, stage and service. The following shows an example of a service in Dynatrace that is tagged with keptn_project, keptn_stage, and keptn_service:
Please consult the Dynatrace documentation on Tags and Metadata to learn more about manual or automated tagging.
For this tutorial you can pass the metadata via an environment variable and then let Dynatrace convert that metadata into tags through Automated Tagging rules: Set the environment variable DT_CUSTOM_PROP with a key-value pair for the tags In Dynatrace, create 3 automated tagging rules named keptn_project, keptn_stage, and keptn_service that extract the respective metadata from the passed environment variable Note 1: If you decide to use different tag names or a different set of tags, make sure to adapt the Dynatrace Note 2: An alternative option is to use the environment variable DT_TAGS, which will automatically convert the passed values into tags:Option 2: Instructions for Dynatrace
keptn_stage, keptn_project, and keptn_service in your deployment manifest and deploy your service:env:
- name: DT_CUSTOM_PROP
value: "keptn_stage=hardening keptn_project=musicshop keptn_service=catalogue"
sli.yaml file, which you will configure later in this tutorial to reflect the tags you put on your service.env:
- name: DT_TAGS
value: "keptn_stage=hardening keptn_project=musicshop keptn_service=catalogue"
Install Keptn just for this use case
If you want to install Keptn just to explore the capabilities of quality gates, you have the option to roll-out Keptn without components for automated delivery and operations. Therefore, set the use-case flag to quality-gates when executing the install command:
keptn install --platform=[aks|eks|gke|kubernetes] --use-case=quality-gates
Configure Keptn and activate the quality gate
- Create a Keptn project (e.g., musicshop) with only one hardening stage declared in the
shipyard-quality-gates.yamlfile:
keptn create project musicshop --shipyard=shipyard-quality-gates.yaml
- Create a Keptn service for your service (e.g., catalogue) you want to evaluate:
keptn create service catalogue --project=musicshop
Note: Since you are not actively deploying a service in this tutorial, keptn create service does not require you to provide a Helm chart compared to the keptn onboard service command.
- To activate the quality gate for your service, upload the
slo-quality-gates.yamlfile:
keptn add-resource --project=musicshop --stage=hardening --service=catalogue --resource=slo-quality-gates.yaml --resourceUri=slo.yaml
Note: The activated quality gate is passed when the absolute value of the response time is below 600ms and the relative change of the response time compared to the previous evaluation is below 10%. The quality gate raises a warning when the absolute value of the response time is below 800ms.
Install SLI provider
For this tutorial, you need to deploy the corresponding SLI provider for your monitoring solution. This can be either the open-source monitoring solution Prometheus or Dynatrace.
Complete steps from section Setup Prometheus SLI provider. To configure Keptn to use the Prometheus SLI provider for your project (e.g. musicshop), execute the following command: Note: if you are using Keptn 0.6.0 instead of 0.6.1 or 0.6.2, you will have to apply the following ConfigMap by executing the following command from within the Configure custom SLIs for the Prometheus SLI provider as specified in Prometheus SLI provider
keptn configure monitoring prometheus --project=musicshop --service=catalogue --suppress-websocket
examples/onboarding-carts folder:kubectl apply -f lighthouse-source-prometheus.yaml
apiVersion: v1
data:
  sli-provider: prometheus
kind: ConfigMap
metadata:
  name: lighthouse-config-PROJECTNAME
  namespace: keptn
sli-config-prometheus.yaml:keptn add-resource --project=musicshop --stage=hardening --service=catalogue --resource=sli-config-prometheus.yaml --resourceUri=prometheus/sli.yaml
Complete steps from section Setup Dynatrace SLI provider. To configure Keptn to use the Dynatrace SLI provider for your project (e.g. musicshop), execute the following command: Note: if you are using Keptn 0.6.0 instead of 0.6.1 or 0.6.2, you will have to apply the following ConfigMap by executing the following command from within the Configure custom SLIs for the Dynatrace SLI provider as specified in Dynatrace SLI provider
keptn configure monitoring dynatrace --project=musicshop --suppress-websocket
examples/onboarding-carts folder:kubectl apply -f lighthouse-source-dynatrace.yaml
apiVersion: v1
data:
  sli-provider: dynatrace
kind: ConfigMap
metadata:
  name: lighthouse-config-PROJECTNAME
  namespace: keptn
sli-config-dynatrace-no-deployment-tag.yaml:keptn add-resource --project=musicshop --stage=hardening --service=catalogue --resource=sli-config-dynatrace-no-deployment-tag.yaml --resourceUri=dynatrace/sli.yaml
Quality gates in action
At this point, your service is ready and you can now start triggering evaluations of the SLO. A quality gate is a two-step procedure that consists of starting the evaluation and polling for the results.
At a specific point in time, e.g., after you have executed your tests or you have waited for enough live traffic, you can either start the evaluation of a quality gate manually using the Keptn CLI, or automate it by either including the Keptn CLI calls in your automation scripts, or by directly accessing the Keptn REST API.
Keptn CLI
- Execute a quality gate evaluation by using the Keptn CLI to send event start-evaluation:
keptn send event start-evaluation --project=musicshop --stage=hardening --service=catalogue --timeframe=5m
This start-evaluation event will kick off the evaluation of the SLO of the catalogue service over the last 5 minutes. Evaluations can be done in seconds but may also take a while as every SLI provider needs to query each SLI first. This is why the Keptn CLI will return the keptnContext, which is basically a token we can use to poll the status of this particular evaluation. The output of the previous command looks like this:
Starting to send a start-evaluation event to evaluate the service catalogue in project musicshop
ID of Keptn context: 6cd3e469-cbd3-4f73-xxxx-8b2fb341bb11
- Retrieve the evaluation results by using the Keptn CLI to get event evaluation-done:
keptn get event evaluation-done --keptn-context=6cd3e469-cbd3-4f73-xxxx-8b2fb341bb11
The result comes in the form of the evaluation-done event, which is specified here.
Keptn API
- First, get the Keptn API endpoint and token by executing the following commands:
KEPTN_ENDPOINT=https://api.keptn.$(kubectl get cm keptn-domain -n keptn -ojsonpath={.data.app_domain})
KEPTN_API_TOKEN=$(kubectl get secret keptn-api-token -n keptn -ojsonpath={.data.keptn-api-token} | base64 --decode)
- Prepare the POST request body by filling out the next JSON object:
{
  "type": "sh.keptn.event.start-evaluation",
  "source": "curl",
  "data": {
    "start": "2019-11-21T11:00:00.000Z",
    "end": "2019-11-21T11:05:00.000Z",
    "project": "musicshop",
    "stage": "hardening",
    "service": "catalogue",
    "teststrategy": "manual"
  }
}
Note: Please take attention that the above CloudEvent contains the property "teststrategy": "manual". This is required to tell Keptn that a test had been manually executed; meaning that a test had been triggered by a tool other than Keptn.
- Execute a quality gate evaluation by sending a POST request with the Keptn API token and the prepared payload:
curl -X POST "http://api.keptn.12.34.56.78.xip.io/v1/event" -H "accept: application/json" -H "x-token: YOUR_KEPTN_TOKEN" -H "Content-Type: application/json" -d "{ \"data\": { \"end\": \"2019-11-21T11:05:00.000Z\", \"project\": \"musicshop\", \"service\": \"catalogue\", \"stage\": \"hardening\", \"start\": \"2019-11-21T11:00:00.000Z\", \"teststrategy\": \"manual\" }, \"source\": \"curl\", \"type\": \"sh.keptn.event.start-evaluation\"}"
This request will kick off the evaluation of the SLO of the catalogue service over the last 5 minutes. Evaluations can be done in seconds but may also take a while as every SLI provider needs to query each SLI first. This is why the Keptn API will return the keptnContext, which is basically a token we can use to poll the status of this particular evaluation. The response to the POST request looks like this:
{"keptnContext":"384dae76-2d31-41e6-9204-39f2c1513906","token":"eyJhbGciOiJIUzI1NiIsInR5cCI6IkpXVCJ9.eyJleHAiOjE2MDU0NDA4ODl9.OdkhIoJ9KuT4bm7imvEXHdEPjnU0pl5S7DqGibNa924"}
- Send a GET request to retrieve the evaluation result:
curl -X GET "http://api.keptn.12.34.56.78.xip.io/v1/event?keptnContext=KEPTN_CONTEXT_ID&type=sh.keptn.events.evaluation-done" -H "accept: application/json" -H "x-token: YOUR_KEPTN_TOKEN"
The result comes in the form of the evaluation-done event, which is specified here.
Built with  by Dynatrace