Home / Docs / Release 0.6.2 / Tutorials / Self-healing / Up-scale with Prometheus
Up-scale with Prometheus
Demonstrates how to use the self-healing mechanisms of Keptn to solve a problem in a production stage by providing automated upscaling.
About this tutorial
In this tutorial, you will learn how to use the capabilities of Keptn to provide self-healing for an application without modifying code. The following tutorial will scale up the pods of an application if the application undergoes heavy CPU saturation.
Prerequisites
- See Self-healing.
Configure monitoring
To inform Keptn about any issues in a production environment, monitoring has to be set up. The Keptn CLI helps with the automated setup and configuration of Prometheus as the monitoring solution running in the Kubernetes cluster.
To add these files to Keptn and to automatically configure Prometheus, execute the following commands:
Make sure you are in the correct folder of your examples directory:
cd examples/onboarding-cartsTell the Prometheus service how to retrieve the SLI value you would like to inspect:
keptn add-resource --project=sockshop --stage=production --service=carts --resource=sli-config-prometheus.yaml --resourceUri=prometheus/sli.yamlConfigure remediation actions for up-scaling based on Prometheus alerts:
keptn add-resource --project=sockshop --stage=production --service=carts --resource=remediation.yaml --resourceUri=remediation.yamlConfigure Prometheus with the Keptn CLI (this configures the Alert Manager based on the slo.yaml file):
keptn configure monitoring prometheus --project=sockshop --service=carts
Click here to inspect the file that has been added.
remediation.yaml
  remediations:
  - name: response_time_p90
    actions:
    - action: scaling
      value: +1
  - name: Response time degradation
    actions:
    - action: scaling
      value: +1
Run the tutorial
Generate load for the service
To simulate user traffic that is causing an unhealthy behavior in the carts service, please execute the following script. This will add special items into the shopping cart that cause some extensive calculation.
Move to the correct folder:
cd ../load-generation/binStart the load generation script depending on your OS (replace _OS_ with linux, mac, or win):
./loadgenerator-_OS_ "http://carts.sockshop-production.$(kubectl get cm keptn-domain -n keptn -o=jsonpath='{.data.app_domain}')" cpu(optional:) Verify the load in Prometheus.
- Make a port forward to access Prometheus:
kubectl port-forward svc/prometheus-service -n monitoring 8080:8080Access Prometheus from your browser on http://localhost:8080.
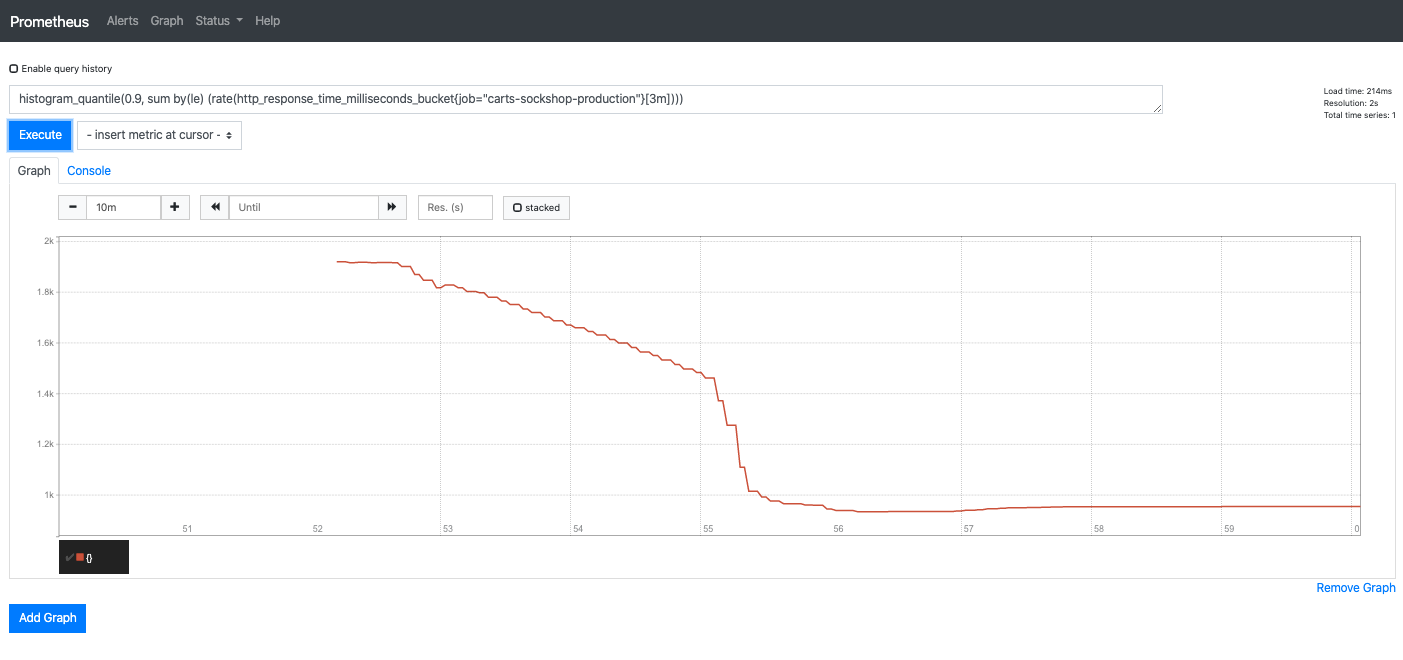
In the Graph tab, add the expression
histogram_quantile(0.9, sum by(le) (rate(http_response_time_milliseconds_bucket{job="carts-sockshop-production"}[3m])))Select the Graph tab to see your Response time metrics of the
cartsservice in thesockshop-productionenvironment.You should see a graph which locks similar to this:

Prometheus load
Watch self-healing in action
After approximately 10-15 minutes, the Alert Manager will send out an alert since the service level objective is not met anymore.
To verify that an alert was fired, select the Alerts view where you should see that the alert
response_time_p90is in thefiringstate: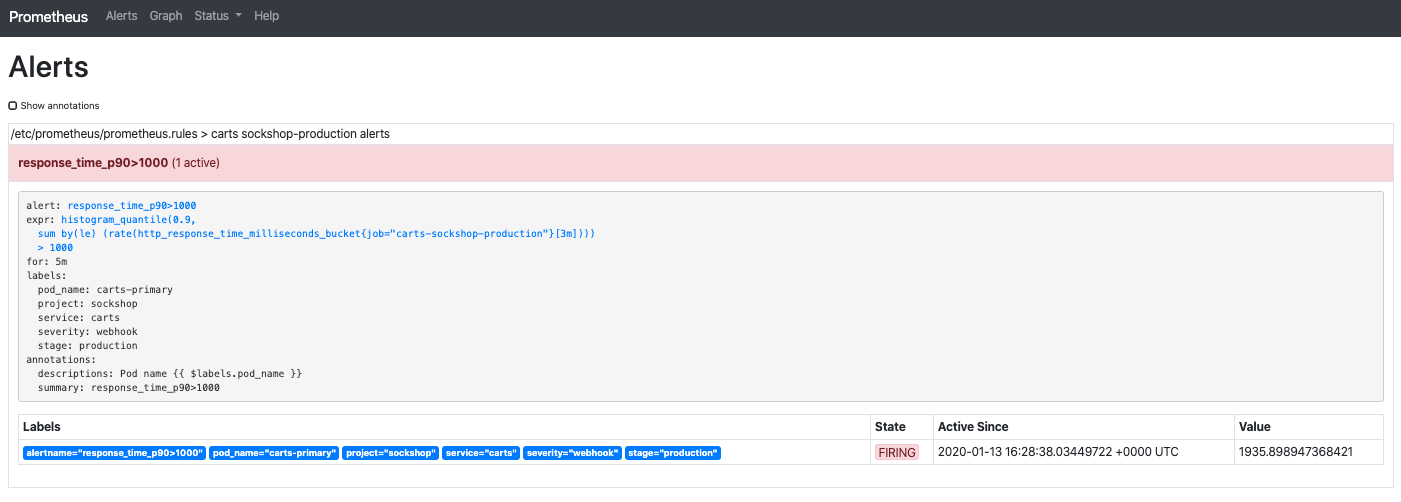
Alert manager
After receiving the problem notification, the prometheus-service will translate it into a Keptn CloudEvent. This event will eventually be received by the remediation-service that will look for a remediation action specified for this type of problem and, if found, execute it.
In this tutorial, the number of pods will be increased to remediate the issue of the response time increase.
Check the executed remediation actions by executing:
kubectl get deployments -n sockshop-productionYou can see that the
carts-primarydeployment is now served by two pods:NAME DESIRED CURRENT UP-TO-DATE AVAILABLE AGE carts-db 1 1 1 1 37m carts-primary 2 2 2 2 32mAlso you should see an additional pod running when you execute:
kubectl get pods -n sockshop-productionNAME READY STATUS RESTARTS AGE carts-db-57cd95557b-r6cg8 1/1 Running 0 38m carts-primary-7c96d87df9-75pg7 2/2 Running 0 33m carts-primary-7c96d87df9-78fh2 2/2 Running 0 5mTo get an overview of the actions that got triggered by the response time SLO violation, you can use the Keptn Bridge. If you have not exposed the Bridge yet, execute the following command:
keptn configure bridge --action=exposeThe Keptn Bridge is then available on: `https://bridge.keptn.YOUR.DOMAIN/
In this example, the bridge shows that the remediation service triggered an update of the configuration of the carts service by increasing the number of replicas to 2. When the additional replica was available, the wait-service waited for ten minutes for the remediation action to take effect. Afterwards, an evaluation by the lighthouse-service was triggered to check if the remediation action resolved the problem. In this case, increasing the number of replicas achieved the desired effect, since the evaluation of the service level objectives has been successful.
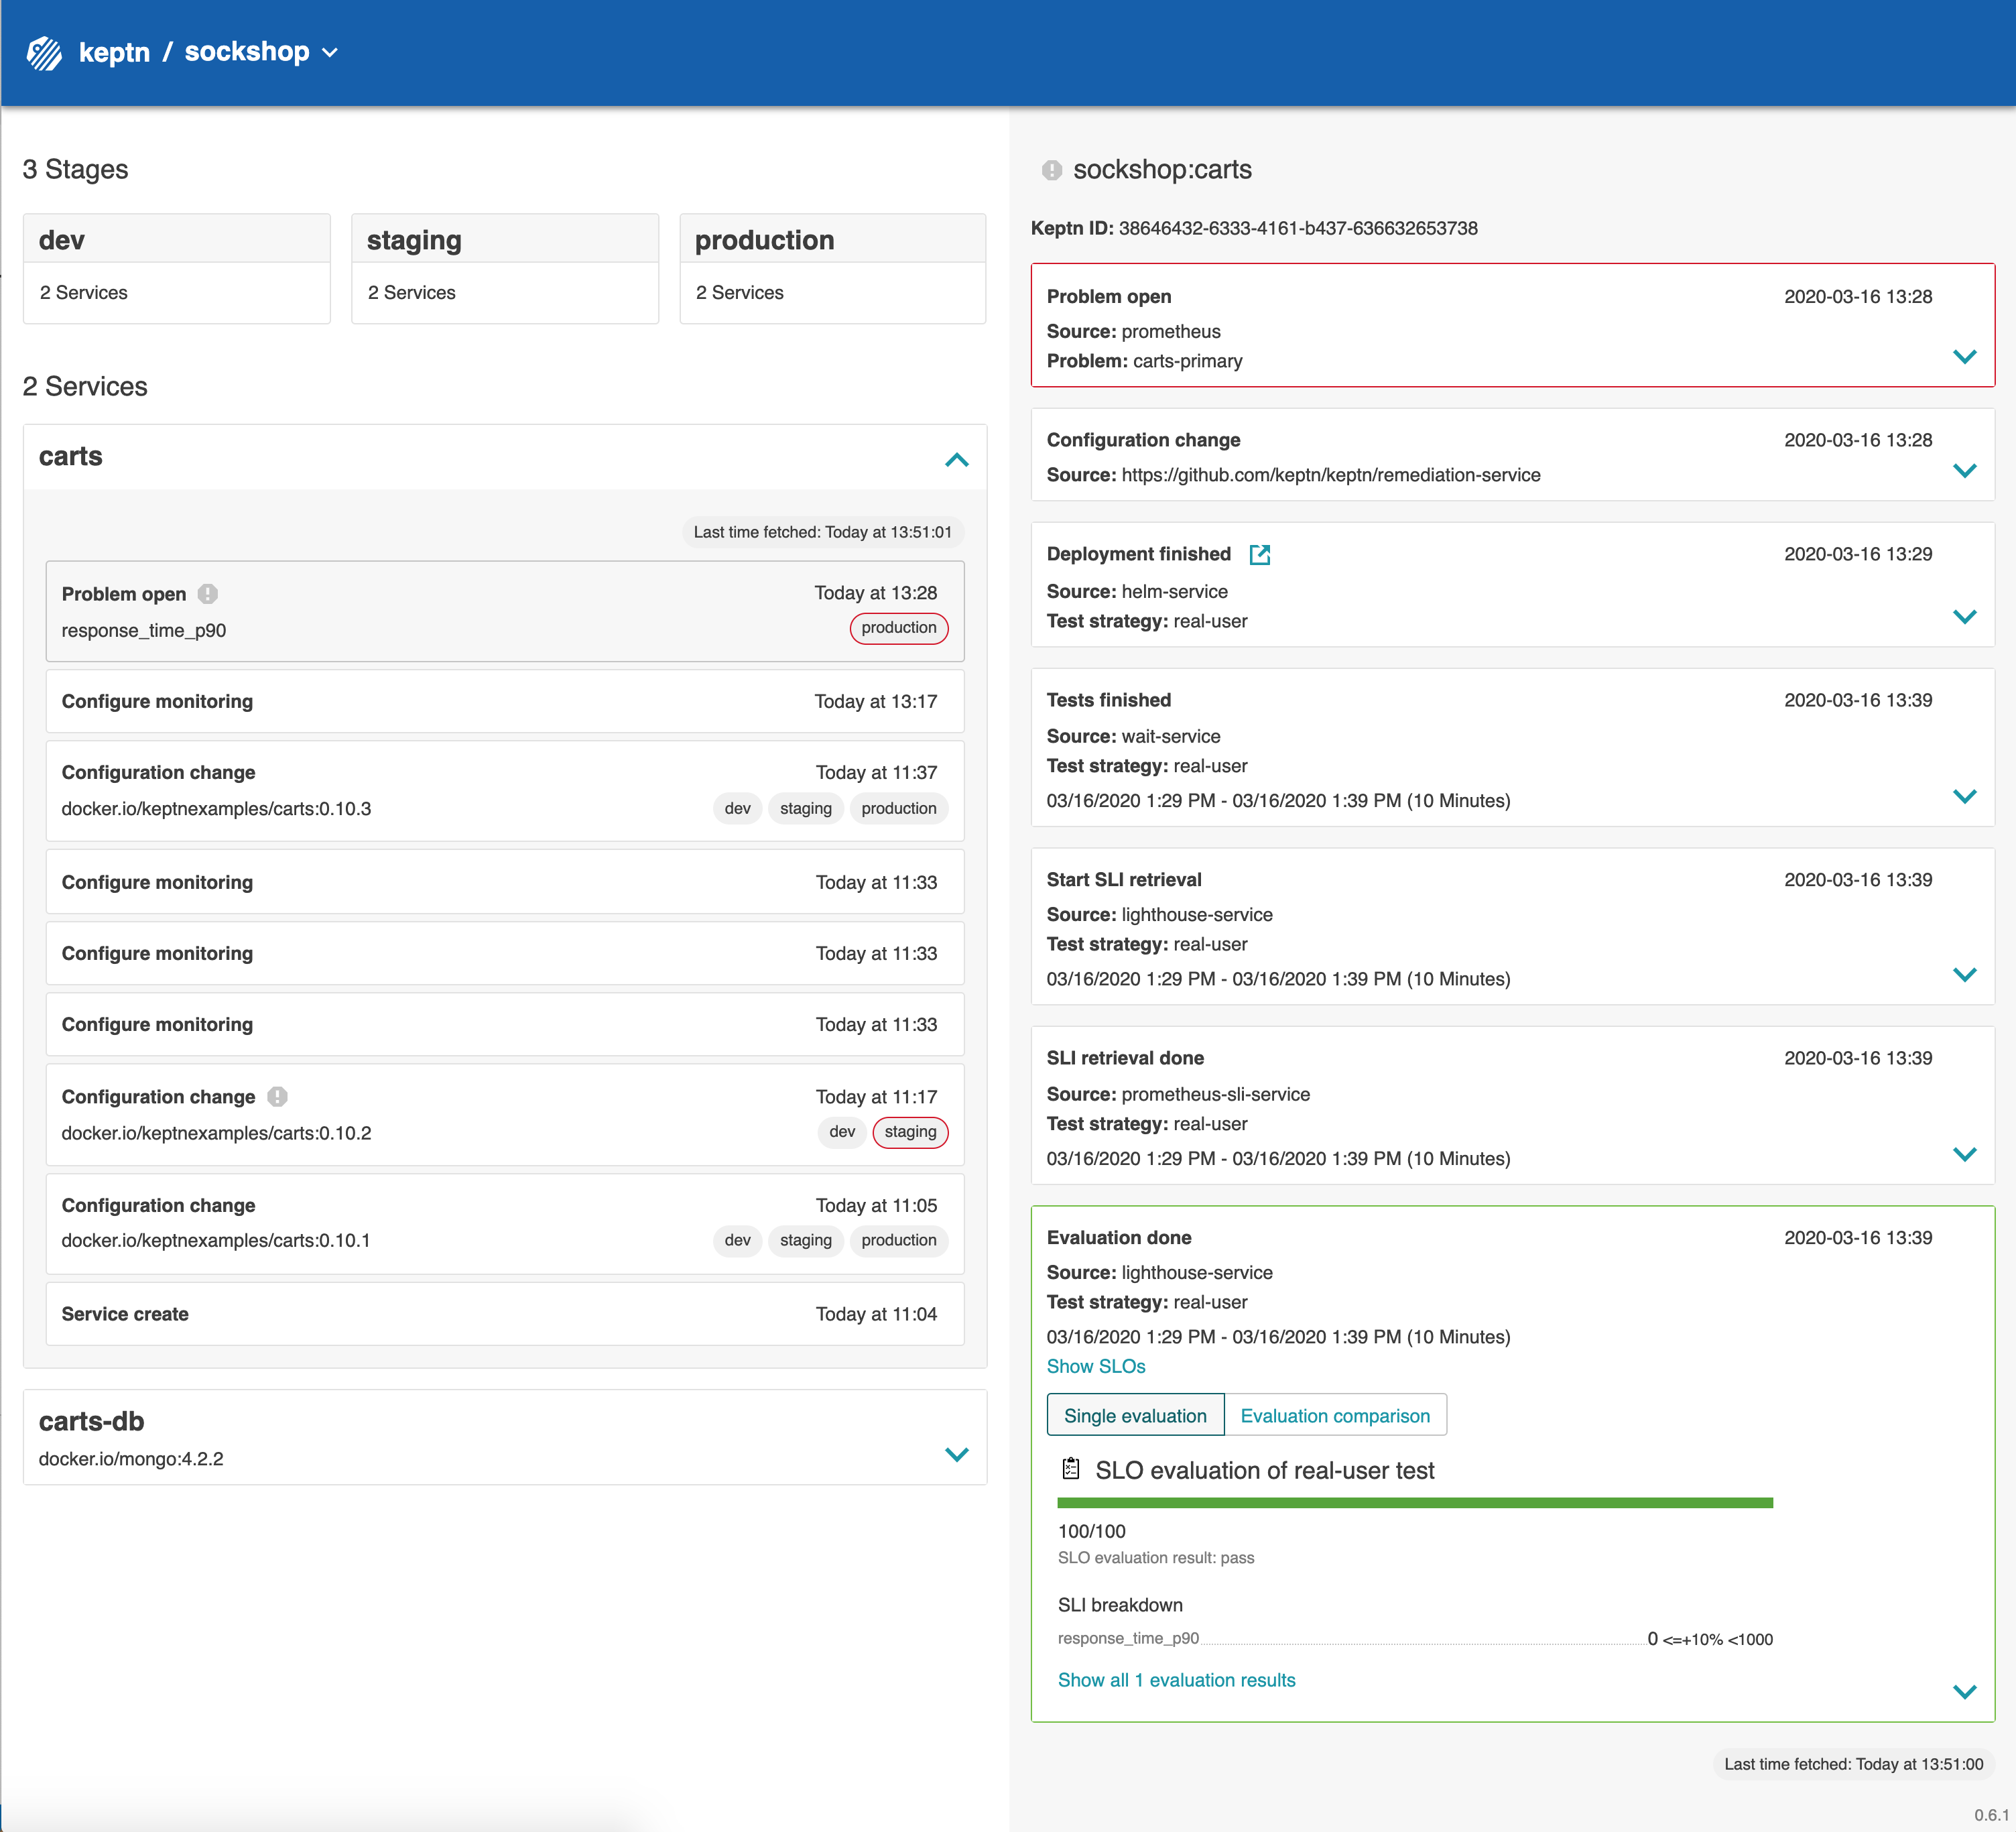
Problem event in Keptn's Bridge Furthermore, you can use Prometheus to double-check the response time:
Prometheus load
Built with  by Dynatrace