Home / Docs / Develop / Monitoring / Prometheus / Install
Install
In order to evaluate the quality gates and allow self-healing in production, we have to set up monitoring to get the needed data.
Prerequisites
- Keptn project and at least one onboarded service must be available.
Setup Prometheus
After creating a project and service, you can setup Prometheus monitoring and configure scrape jobs using the Keptn CLI.
To install the prometheus-service, execute:
kubectl apply -f https://raw.githubusercontent.com/keptn-contrib/prometheus-service/release-0.3.3/deploy/service.yamlExecute the following command to set up the rules for the Prometheus Alerting Manager:
keptn configure monitoring prometheus --project=PROJECTNAME --service=SERVICENAME
Verify Prometheus setup in your cluster
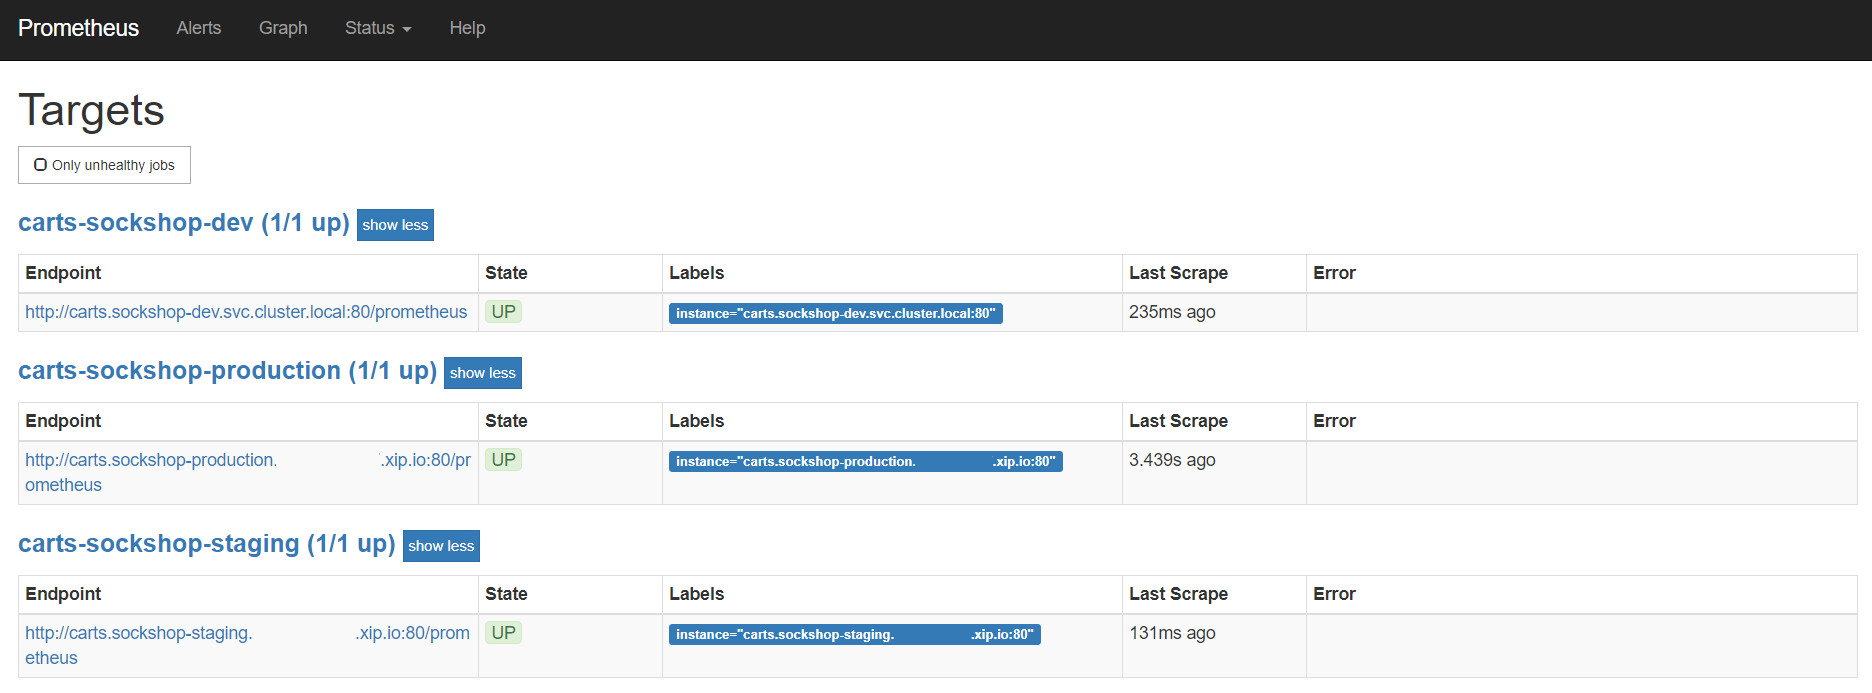
To verify that the Prometheus scrape jobs are correctly set up, you can access Prometheus by enabling port-forwarding for the prometheus-service:
kubectl port-forward svc/prometheus-service 8080 -n monitoring
Prometheus is then available on localhost:8080/targets where you can see the targets for the service:


